Analysis
Analyze Results
Once the information regarding technology usage, information requirements and acceptable downtimes has been gathered from the business processes, it is necessary to collate all the results and analyse them to determine the Recovery Time Objectives for each item of software, hardware, information and telephony used by the critical processes and the Recovery Point Objectives for the information requirements (critical data).
HB 292-2006 suggests one approach to consolidating and summarising this information is to construct a resource matrix which allows for mapping of the requirements over the whole or parts of the organisation.
Depending on the size of the organisation and the complexity of the resource requirements, there may be one resource matrix, which collates all the requirements identified in the BIA, or there may be several resource matrices, which individually show the required resources for staffing, technology, information/data, premises, equipment and materials. An example of a single Resource Matrix is shown in the following table.
| Critical Business Process | Location |
Process RTO (Days)
|
Additional Critical Applications,
showing their Required RTO (days) |
Critical Data |
RPO for Data (Days)
|
||||
|
Workflow
|
MAD
|
CIS
|
Pay Master
|
GLedger
|
|||||
| Mortgage Applications | Glenalmond House |
1
|
2
|
1
|
0
|
0
|
0
|
Customer Details
|
1
|
| Mortgage Customer Services | Riverside House |
0.5
|
2
|
1
|
1
|
0
|
0
|
Customer Details
|
1
|
| Payroll | Riverside House |
5
|
0
|
0
|
0
|
10
|
5
|
Financial Accounts
|
1
|
| Mortgage Payment Defaults | Gleneagles House |
3
|
0
|
0
|
5
|
0
|
3
|
Customer Details
|
1
|
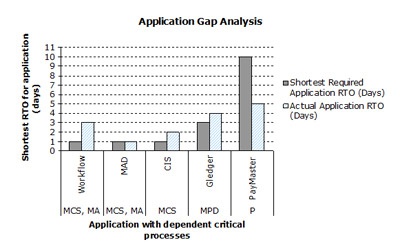
From this Technology Resource Matrix an Application Resource Matrix could be constructed which only shows the applications and displays the information a different way. This representation highlights the discrepancy between the RTO required for that particular IT component (Required Application RTO) and the actual RTO (Required Application RTO):
| Application | Critical Business Process Dependency |
Required Application
RTO (days) |
Actual Application
RTO (days) |
| Workflow | Mortgage Applications |
2
|
3
|
| Mortgage Customer Service |
2
|
3
|
|
| MAD | Mortgage Applications |
1
|
1
|
| Mortgage Customer Service |
1
|
1
|
|
| CIS | Mortgage Customer Service |
1
|
3
|
| Mortgage Payment Defaults |
5
|
3
|
|
| Paymaster | Payroll |
10
|
5
|
| GLedger | Payroll |
5
|
2
|
| Mortgage Payment Defaults |
3
|
2
|
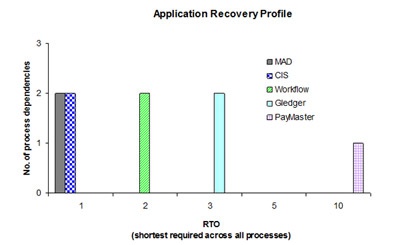
An Application Recovery Profile can then be determined which shows the order of priority of restoration of the critical applications, to meet the requirements of its most critical dependent process(es). The information is presented in the following table and as a graph below.
If more than one process is dependent upon an application, the needs of the least critical process will be met by restoring the application to meet the requirements of the most critical application (e.g. Payroll and Mortgage Payment Defaults are both dependent upon GLedger. By restoring GLedger within 3 days for Mortgage Payment Defaults, Payroll’s requirement of 5 days has also been met).
| Shortest required application RTO (days) |
Number of processes depending upon each application
|
||||
|
MAD
|
CIS
|
Workflow
|
GLedger
|
Pay Master
|
|
|
1
|
2
|
2
|
0
|
0
|
0
|
|
2
|
0
|
0
|
2
|
0
|
0
|
|
3
|
0
|
0
|
0
|
2
|
0
|
|
10
|
0
|
0
|
0
|
0
|
1
|
This is a very simplified Recovery Profile for illustrative purposes only; other factors may need to be considered such as inter-dependencies between applications, use of IT resource over different locations, prioritisation when several applications need to be restored at the same time or existing Service Level Agreements (SLAs) both internally and with third-party suppliers.

There may be instances when the actual RTO for an application (this is the minimum length of time within which ICT can restore it) is greater than the application RTO required by the process. This is illustrated in the figure below. A further explanation of gap analysis is given in the next paragraph.

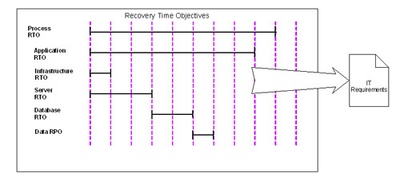
Very often there are several interdependencies between the various IT components (applications, infrastructure, servers, databases), and if all the different component RTOs and RPOs do not match the process requirements these gaps constitute a risk and are highlighted in the IT RequirementsGap Analysis. The relationship between the different RTOs and the potential gap between actual component RTOs and the process RTOs are illustrated in the figure below.

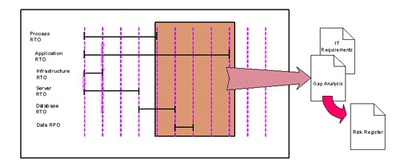
However the process RTO and component RTOs can vary wildly. Processes may require applications to be restored in order to commence work within their RTO, but because of the complexity of today's technology, this may involve restoration of a number of components (e.g. application server, file server, operating systems, infrastructure and data) in order to be able to recover the application for the business unit. An illustration of how the various component RTOs can impact availability of the critical process is shown in the figure below. The discrepancies between the process RTO and the component RTO should be highlighted in an IT Requirements Gap Analysis which should be escalated to the BC Steering Committee, for gaps where there is a significant risk to be included in the Risk Register. In these cases a decision must be taken by the BCSC as to whether the affected business processes should develop manual workarounds, or increase their recovery timescales or whether, alternatively, the ICT or IS departments implement should a solution to improve their response times.
The gap between the process’ requirements and the IT capability is illustrated below.

ICT and IS should also conduct a BIA on their own processes to understand their own needs for recovery so that the needs of the business and ICT can be weighed together.

